
 There is a little known feature hidden deep within your Google Analytics account that is an absolute goldmine of actionable ideas and insights.
If you are like most internet marketers or website owners, you probably use Google Analytics randomly. Clicking on random sections, gleaning anecdotal evidence about your users. Noticing trends or whatnot. If you are like me, you are probably also addicted to the Google analytics mobile app and it’s real time dashboard. Watching people come and go from your websites. This was such a problem for me that I moved the Google Analytics app off my homescreen so I am not tempted to click on it every three minutes.
Bottom line, most of us don’t get close to using Google Analytics properly, let alone mastering it to milk it for all it’s worth and even fewer of us look like an analytics genius while were at it. I am not saying you or I am lazy, but let’s face it…there isn’t enough time in the day, and if someone else can do the heavy lifting for us, why can’t we ask, “Can’t Someone Else Just Do It?!” If this sounds like you, than you will really love this post. Not only did other people do all the work you need to look like a genius, but I am going to show exactly how to steal their reports, dashboards, segments, and tools. Plus, I throw in a bonus tool at the end that can literally put you ahead of almost every other marketer out there.
(For those of you who don’t want the shortcut, here is by far the most valuable information on the internet about Analytics, Google or otherwise. Avinash Kaushik’s Blog! I love this blog so much, but many of his posts build on each other, so when I start reading one, I end up with 20 other posts open in tabs that I need to read first. If you want to blow your mind and are ok with getting a little dizzy, do yourself a favor and read his blog religiously!)
For the rest of us though, there has to be a better way…and there is…hidden deep in your Google Analytics account.
One of the things that frustrate me about businesses today is how much redundancy there is. So many businesses go through the same processes, when they could just as easily share their resources. I think there is huge opportunity in removing these redundancies. I cannot think of any reason why I should have to suffer through creating custom Google Analytics reports in order to glean actual, actionable intelligence. Why should I have to setup all these confusing segments and filters if a much bigger expert, someone like Avinash Kaushik already created these same or even better reports?
Good news. I am not the first person to wonder this. So, this great forum was created for people to share their custom analytics reports. This was a secret weapon in my marketing arsenal which I was reluctant to share. I was able to look like an Analytics master, and all I had to do was click a couple links to import their reports into my account. This was such a great idea that Google decided to create a reports gallery where users can share their custom reports.
You no longer need to dig deep into Avinash’s posts to get great insights, all you need to do is access the Custom Reports Gallery and import Avinash’s entire report collection.
Here’s how:
First, log into your Google Analytics account. Now, look at top menu bar, do you see a link that says, “Customization?” Go ahead and click on that. Your screen should look like this…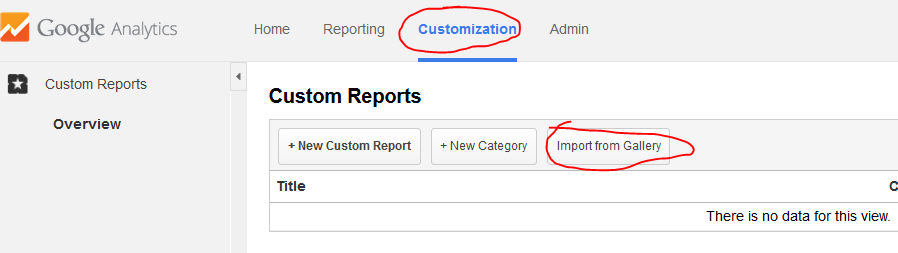
Now, go ahead and click on the “Import From Gallery” Button.
Google Analytics Solutions Gallery should pop up. If not, you can access it from here: https://www.google.com/analytics/gallery/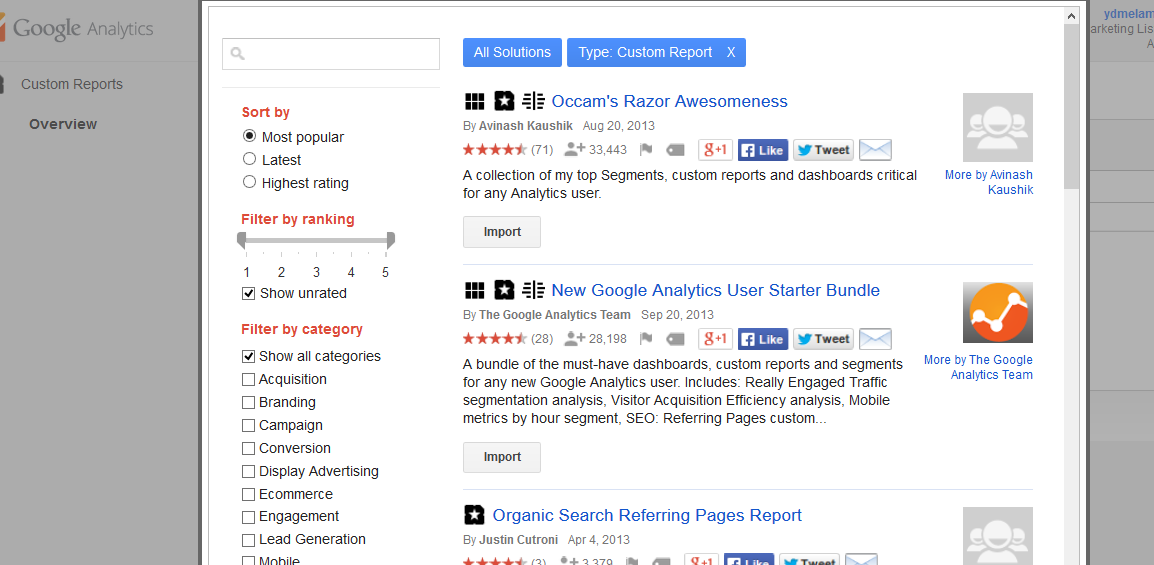
Now, you see that button below each listing that says Import? Just click on that for the reports you want. I highly recommend starting with the first listing called “Occam’s Razor Awesomeness” and click impor
A shared reports permissions page should pop up. You need to select which view to apply these to. As you can see in this screenshot, I chose all visitors. You can also feel free to check or uncheck any of the reports you want or don’t want, and than click create on the bottom.
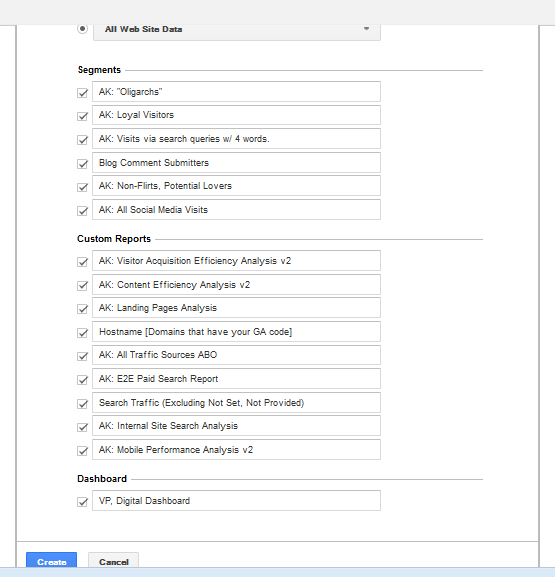
Once you hit create, this will create all these reports, or in the case of This collection, it also creates segments, and dashboards so you can really show off your GA Chops.
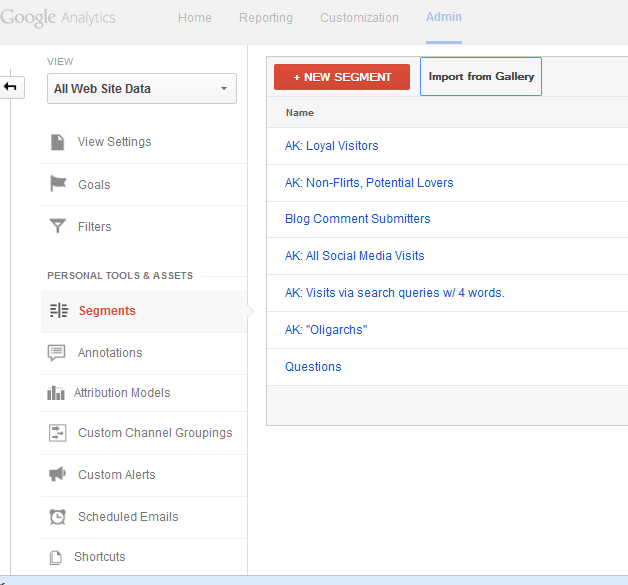
But, you there is still so much more you can do. For starters, look at the sidebar menu and start clicking around. The first thing you will see is the new segments you created. You see in the image below, the link on the bottom that says “Questions” ? well, that nifty features pulls out all the search queries that include a question like what, why, how, who, etc… which is a goldmine of content ideas. After all, these queries were searched by your prospects, so clearly its an informational pain point for them. Lots of other awesomeness in this collection, but if you really want to dress to impress you need this other killer feature…
You want the really fun stuff? You see that link, third from the bottom that says, “Custom Alerts?” Well, that is my secret weapon to both monitor my website for problems, like an increase in 404 errors, but also automating my analysis to a significant degree. Spend the time creating a series of custom alerts, and you will be ahead of 99.99% of marketers out there and almost certainly ahead of anyone you are competing with.
You can even set it to text message you when something important happens.
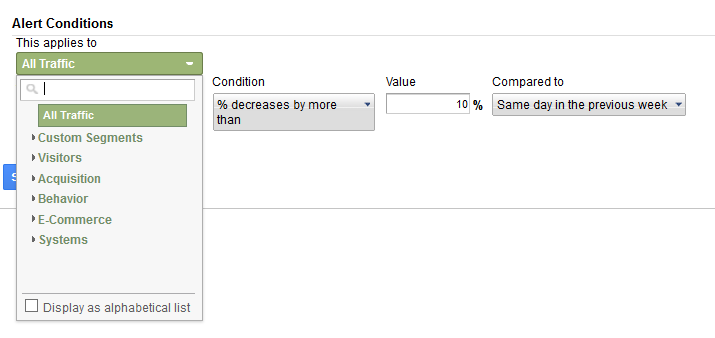
Above you can see a simple example of the custom alerts setup page. In the example above I set it to alert me if all my traffic drops 10% from the same day in the previous week.
With custom alerts you can do amazing things. Pretty much any logic you can think of, you can build an alert around. You can set the alert to check daily, weekly or monthly, and email or text anyone you want to alert.
The first step is deciding what segment to apply your rule to. You can choose any of the custom segments you created, or you imported from the solutions gallery, or pretty much any metric on your site… Setting what to apply the rule to is the first step. As you can see below, you can choose from a bunch of options.
Once you decide what segment you want your rule to apply to, you can start setting the details. Now you just need to decide what action should trigger an alert. Should it be when your bounce rate goes up, or when your pageviews goes down, etc… Here are the options for what event should trigger an alert.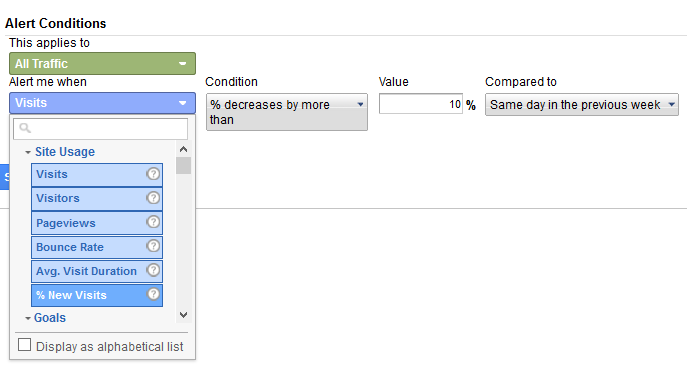
Now, all that’s left is deciding the condition for this rule. Should it be based on an increase in visits or an increase in % of traffic? Your imagination is all that limits you.
These custom alerts are also called intelligence events, and rightfully so because if you were intelligent you would get to setting these up ASAP.
Bottom line, using the resources in Google Analytics solutions library, and setting up custom reports only takes a handful of minutes, and no matter how lazy you are, you can master and milk analytics for all its worth with just a few clicks.
Looking for an SEO service that won’t get you banned?
Source: ShoeMOney
Look Like a Genius in Only 4 Clicks
No comments:
Post a Comment